|
Different Functional Groups
Have Different Variances of Expression Levels |
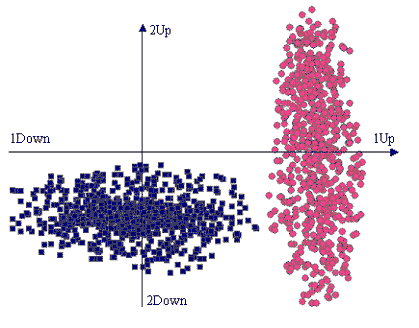
 Two groups of genes with different variances of expression levels
|
Consider
the following situation. The expression levels of a number of genes
are measured under two conditions, 1 and 2. The genes belong to
two functional groups. Those in the first group are up-regulated
in the first condition, but do not show a common tendency in the
second condition, their expression levels varying significantly
around zero. The genes in the second group are down-regulated in
the second condition, but do not show a common tendency in the first,
their expression levels varying significantly around zero. Since
there are only two conditions, such results are conveniently represented
in a two-dimensional drawing, as in the figure on the left, where
the first group is drawn in red circles and the second in blue rectangles. |
|
Most Current Clustering Tools
Ignore the Fact |
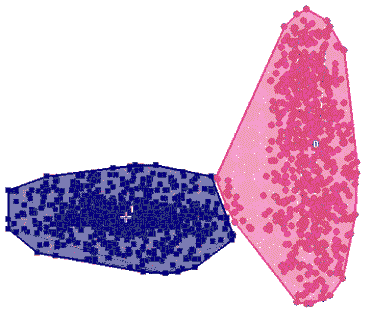
 Best k-Means clustering of the above data
 |
Most
of the currently popular clustering methods, including k-Means,
SOMs, most forms of dendrograms (so-called hierarchical clustering),
VxInsight™ by Sandia Labs, etc., ignore the fact that genes
in different functional groups are regulated by different
biological phenomena, which
often gives rise to different variances
of expression levels among the clusters, as in the above figure.
Indeed, all of those methods rely solely on a measure
of distance (similarity) between profiles. This causes them to miss
the structure of the data whenever the variances differ among the
functional groups, which is most often the case. Thus for instance,
the best k-Means clustering of the above data is depicted on the
left. |
| The
flawed clustering supplied by k-Means is due to the fact that a
number of genes in the blue cluster above have profiles that are
in fact closer to the average of the red cluster. |
| ArrayMiner2
Takes Variances into Account |
The novel clustering
method in ArrayMiner2 is capable of detecting the variances of
data in the two clusters along each dimension, and take them into
account in deciding the membership of each of the genes. This
results in detection of the true structure of the data, leading
to the clustering on the left.
This kind of approach
is traditionaly followed by the EM (Expectation Maximization)
algorithm. However, EM is extremely slow and known to converge
in local optima. Both of these problems are solved in ArrayMiner
thanks to its genetic algorithm technology.
|
 ArrayMiner2 clustering of the above data
 |
|
ArrayMiner2
Detects Outliers
|
In
addition to different variances of expression levels in different
functional groups, real-world data typically feature noise
or outliers, expression
profiles that cannot be reasonably included in any cluster of the
other data. Outliers may be genes with truly unique expression profiles,
or may be due to data collection errors. Outliers should be detected
and put apart, yet a number of currently available clustering methods,
in particular k-Means, nevertheless try to cluster them with the
other data at any cost, further deteriorating the quality of the
classification. In contrast, ArrayMiner2 has a built-in mechanism
for outlier detection.
|
How Many Clusters
?
Current Methods
|
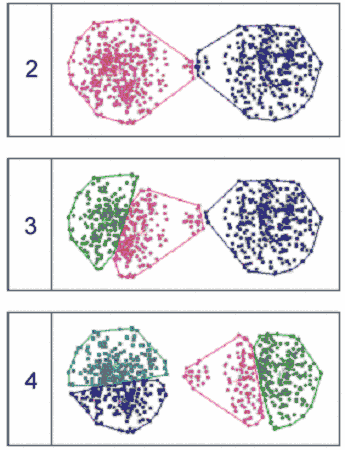
 k-Means clustering into 2, 3 and 4 clusters, respectively
 |
Missing
the structure of the data has for typical consequence that wildly
different "structures" are reported by non-hierarchical
clustering methods, such as k-Means or SOMs, when the requested
number of clusters changes. For instance, the following figure shows
k-Means classifications of a simple set of two-dimensional data
into 2, 3 and 4 clusters, respectively.
The wildly different classifications make
it nearly impossible to decide what is the "right" number
of clusters in the data.
In contrast, ArrayMiner2's clusters are highly stable and consistent
across wide ranges of the number of clusters requested - only the
level of detail changes, the reported structure remains stable.
This allows the user to obtain the desired level of detail: the
"big picture" with a low number of clusters, or minute
differences between expression profiles with a high number of clusters.
This is illustrated in the figure on the left.
|
How Many Clusters
?
ArrayMiner2 Method
|
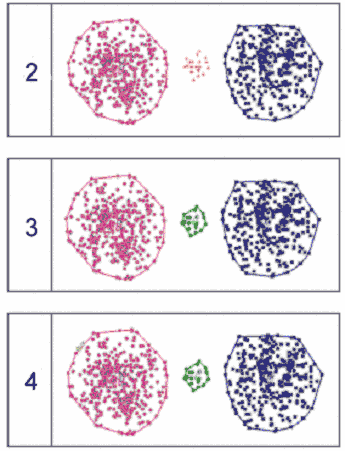
 ArrayMiner2 clustering into 2, 3 and 4 clusters, respectively
 |
When clustering
the same data into two clusters, ArrayMiner2 detected the two
large groups of data points as the most salient feature (the "big
picture") in the data, as depicted in the figure on the left.
The middle group was correctly identified as not
being part of either of the two, but since only two clusters were
requested, those data points were classified as outliers. When
clustering into three clusters, the three groups were correctly
identified and no outliers were reported. When clustering into
four clusters, a small number of highly similar data points were
detected inside the large red group and classified as an extra
cluster.
|
| Learn
More about the Algorithm |
The
above examples illustrate the advantages of ArrayMiner2 in an easy-to-see
manner, using simple two-dimensional examples. To learn more about
ArrayMiner2's clustering method, and to appreciate its value on
real-world data, download the ArrayMiner2 White Paper here. |
|
