|
The following example illustrates the dramatic
effect the choice of a clustering method can have on the clusters obtained.
We compare here the ArrayMiner Gaussian
clustering to k-Means,
one of the most widely used clustering methods.
The test sample used in the comparison
includes 5 generated clusters. The following figures depict the clustering
results of the two methods for a number of clusters going from 3 to 7.
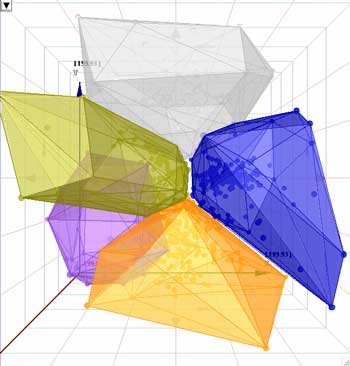
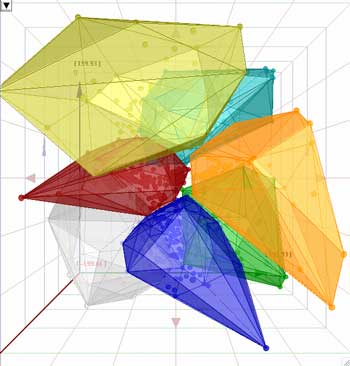
The first series of results (orange column) was obtained with the k-Means
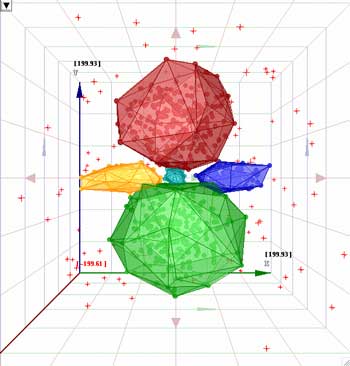
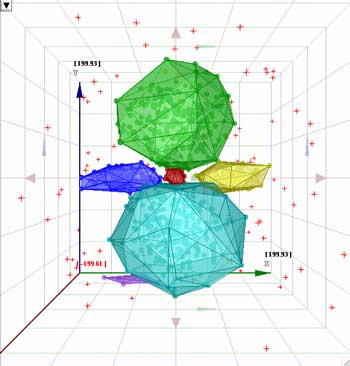
algorithm, and the other (green column) with the ArrayMiner Gaussian algorithm.
The results obtained with ArrayMiner are far
better than the k-Means results, for multiple reasons:
-
The ArrayMiner statistical model is not based on
simple point-to-center distances, but on the Gaussian probability
to belong to a cluster. That enables ArrayMiner to detect the cluster
in the center of the following figures. That cluster has a smaller
variance than the other clusters. In fact, few if any distance-based
methods (k-Means, SOMs, and others) can detect such a cluster, because
it is located too near to other clusters with higher variance. These
larger clusters have peripheral points that are closer to the center
of the small cluster's center than to their own center, resulting
in a bad point assignment for distance-based methods.
| K-Means
algorithm |
| |
| k-Means, 5
clusters requested |
|
| ArrayMiner
Gaussian method |
| |
| ArrayMiner,
5 clusters requested |
|
View
the figures in 3D |
If your browser is java
enabled, you can easily compare the two figures above in an interactive
3D applet here. |
- The ArrayMiner method detects outliers, genes that do not belong to
any cluster (depicted with red crosses in the green column). The outliers
are detected in ArrayMiner by comparing their probability to belong
to a cluster to their probability to be part of a uniform random noise.
Exclusion of outliers from clusters significantly increases the robustness
of ArrayMiner's clusters. Most other methods include all points into
clusters at any cost, making them very sensitive to the noise always
present in biological data.
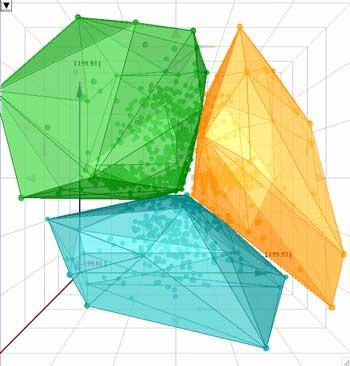
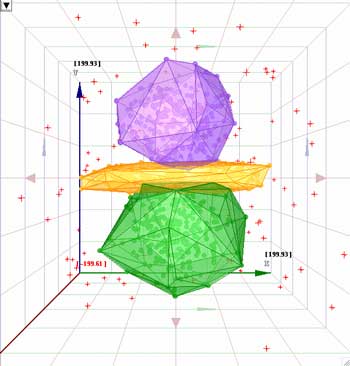
- Even when the requested number of clusters differs from the "real"
number present in the data, ArrayMiner identifies the true structure
of the data. This is illustrated in the following figures, where respectively
3 and 7 clusters were requested, for a dataset with 5 clusters. In fact,
ArrayMiner's results are like a satellite view of your data, where the
precision depends on the satellite resolution, giving you the possibility
to identify continents at low resolutions, countries at average resolutions
and cities at higher resolutions. The choice of the number of clusters
is not as important as with other methods because the structure of the
data is not lost when changing resolution, as is the case with k-Means
(orange column).
- ArrayMiner performs a rigorous optimization process. This means that
it does not stay stuck in a local optimum as would k-Means. ArrayMiner
uses a state of the art genetic algorithm to explore the solution space
remarkably fast. (More on genetic algorithm here)
| K-Means
algorithm |
| |
| k-Means, 3
clusters requested |
|
| ArrayMiner
Gaussian method |
| |
| ArrayMiner,
3 clusters requested |
|
| K-Means
algorithm |
| |
| k-Means, 7
clusters requested |
|
| ArrayMiner
Gaussian method |
| |
| ArrayMiner,
7 clusters requested |
|
Download the test file in a zipped csv format
here. |